-
Chart of the Week
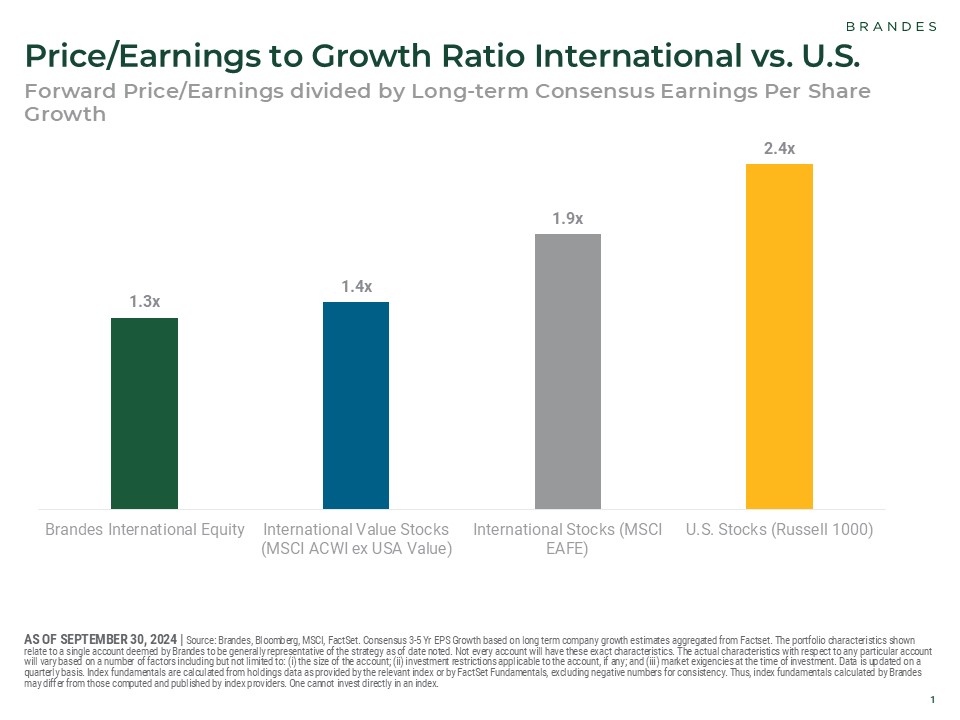
International and international value stocks look attractive to us relative to their current valuation levels.
Full story
-
Chart of the Week
Value stocks in international markets are near their largest discounts relative to growth stocks. Historically, large discounts have preceded appealing returns for international value stocks versus the broad market.
Full story
-
Chart of the Week
Despite recent history, United States has not always outperformed the rest of the world. Allocating to international equities can help provide diversification and manage portfolio volatility.
Full story
-
Chart of the Week
The opportunity set for large-cap companies expands considerably when you consider non-U.S. companies.
Full story
-
Chart of the Week
Value outperformance relative to the broad market (MSCI World Value vs. MSCI World) in recent years did little to close the valuation gap between value and growth, which remains attractively wide, in our opinion. Historically, such valuation gaps preceded appealing returns for value relative to the broad market.
Full story
-
Chart of the Week
We believe Brandes International Equity is well positioned as a complement to growth exposure given our performance versus the value peer median in pro-value markets (when MSCI EAFE Value outperformed MSCI EAFE).
Full story
-
Chart of the Week
We ranked the price/book of international growth and value stocks for each quarter going back to 1974 and divided the results into quintiles. During quarters when the P/B of value stocks was less expensive (i.e., discounted) relative to the P/B of growth stocks, value stocks tended to outperform over the subsequent 5-year period. The greater the discount, the greater the outperformance.
Full story
-
Chart of the Week
While value stocks (MSCI ACWI Value) have underperformed growth (MSCI ACWI Growth) for the past decade, dividends of value stocks have been slightly stronger than that of growth stocks.
Full story
-
Chart of the Week
Despite their pullback in 2022, technology stocks have contributed more to global equity returns (MSCI ACWI) than their average index weight over the last 5 years. While, more typical value sectors such as financials have contributed less than their index weight.
Full story
-
Chart of the Week
Even after their outperformance so far in 2023, international stocks (MSCI EAFE) continue to trade at an appealing discount relative to U.S. stocks (MSCI USA) as of June 30. Such discount levels have historically preceded positive relative returns for international vs. U.S. stocks, indicating—in our opinion—that now may be a good time to allocate to international equities.
Full story
-
Chart of the Week
U.S. dollar strength in the past decade, combined with U.S. stocks’ robust performance, had led some investors to be wary of investing in companies outside of the United States. However, after hitting a high in September 2022, the U.S. dollar started to tumble against a basket of foreign currencies. Historically, weakening U.S. dollar has been positively correlated with the outperformance of international stocks (MSCI EAFE) vs. U.S. stocks (MSCI USA). As such, we believe now is an opportune time for investors to consider international equities.
Full story
-
Chart of the Week
International equities (MSCI EAFE) outperformed their U.S. counterparts (MSCI USA) for the year through March 31, 2023. Amid this outperformance, we continue to believe the asset class remains a fertile ground for value opportunities, with higher average dividend yield and more companies with earnings yield of over 8% compared to the U.S. equity asset class.
Full story
-
Chart of the Week
While many U.S. companies do derive a portion of their revenues from abroad, we believe investors may benefit from a dedicated allocation to international equities. As U.S. businesses overall trade at a premium relative to their non-U.S. peers (based on forward price/earnings), investing in U.S. companies may not be the best way to access international opportunities from a price standpoint.
Full story
-
Chart of the Week
From stubbornly elevated inflation to persistently high discount levels for value stocks (vs. growth stocks and the broader market), we believe the current investing environment is supportive of an allocation to value management. After a prolonged growth-led cycle, however, finding a true value asset manager might not be as simple as it appears. Morningstar classified global equity large-cap funds with more than $100 million in assets under management (AUM) by exposure to what it considers value securities. It found that only 8% of the category’s AUM was in funds with more than 35% exposure to value securities, while 71% of AUM was in funds with less than 25% exposure to value securities.
Full story
-
Chart of the Week
From 9/30/20 to 12/31/22, the MSCI World Value Index outperformed the MSCI World Growth Index by 37.1% cumulatively.[1] Nevertheless, this outperformance did little to narrow the historically wide gap between the valuations for value stocks and those for growth stocks. At the end of this period, value stocks continued to trade at high levels of discount vs. growth stocks across various valuation metrics, indicating—in our opinion—that there is still a positive outlook for value.
Full story
-
Chart of the Week
We believe that after a decade of lackluster performance, the recent performance of value stocks (MSCI World Value) has been remarkable. It has also raised the question: Is it too late to tap into the potential of this style factor?
Full story
-
Chart of the Week
As value stocks have historically done well during periods of elevated interest rates, we believe now is an opportune time for investors to consider an allocation to this investing style.
Full story
-
Chart of the Week
Because markets historically move in cycles, with some asset classes having outperformed others one year and then underperforming them the next, diversification could help reduce the volatility of a portfolio’s returns.
Full story